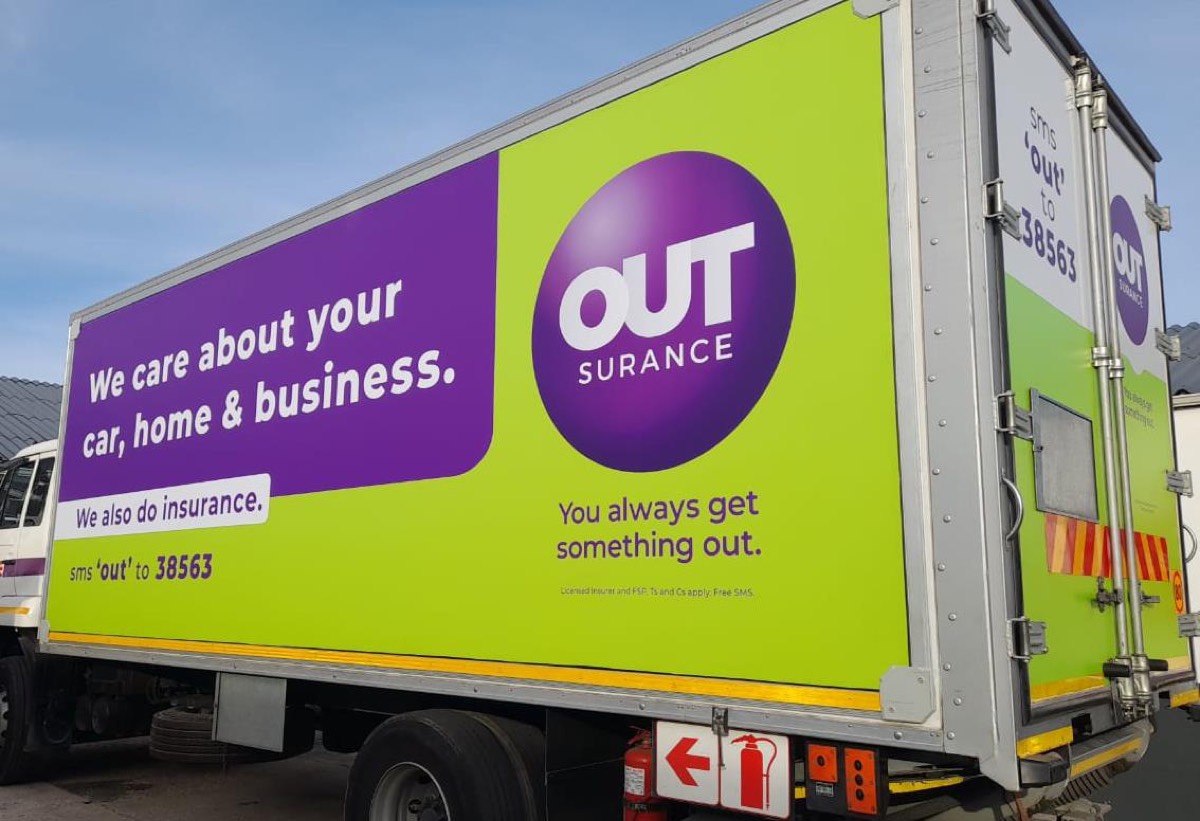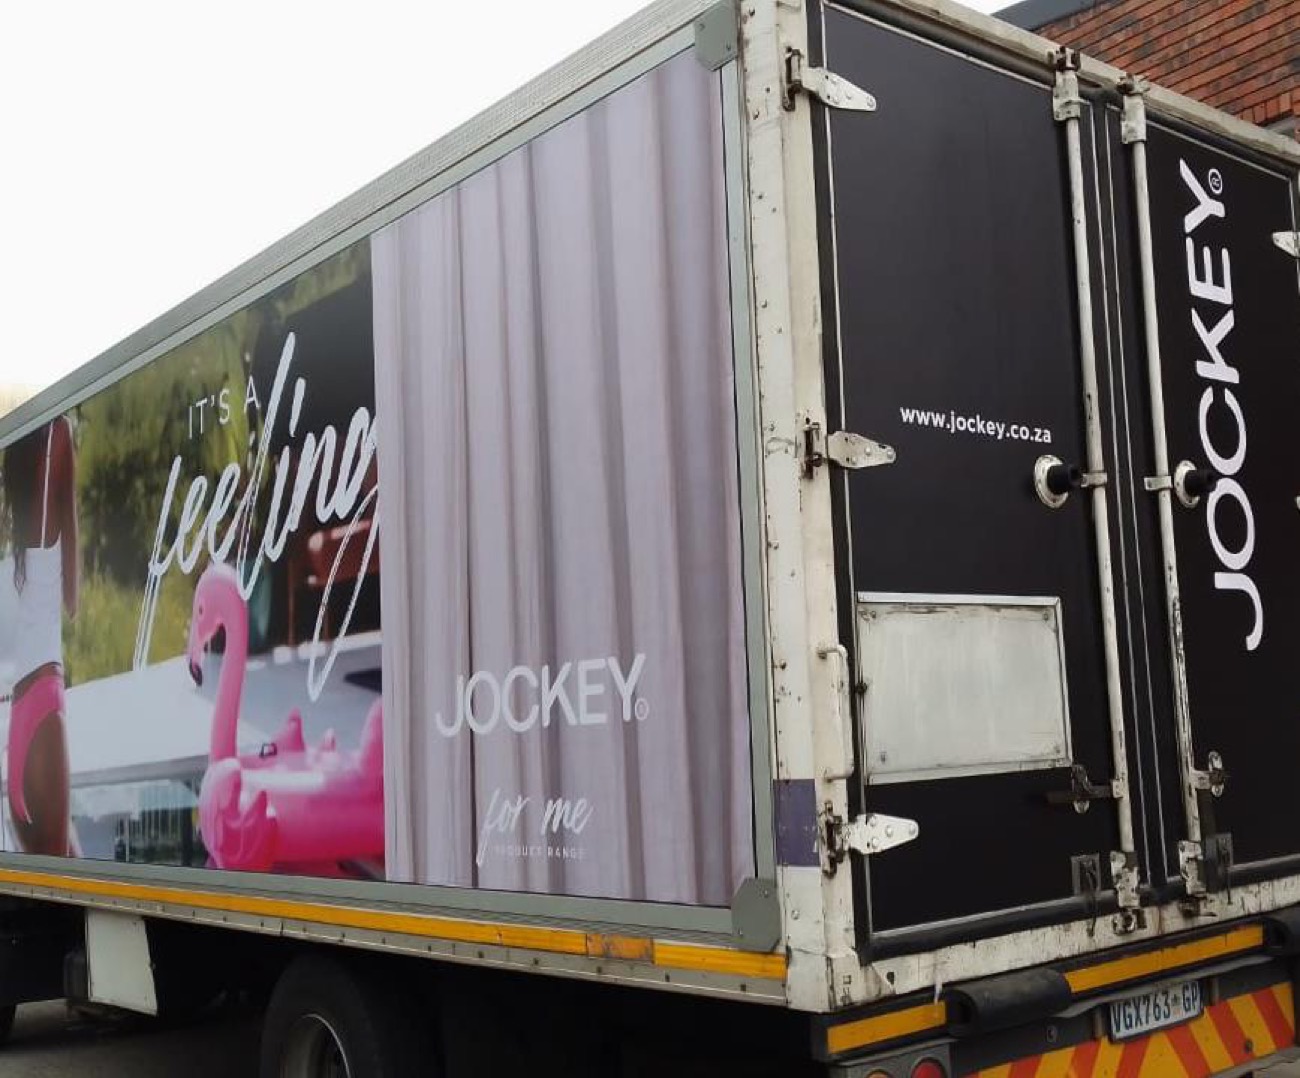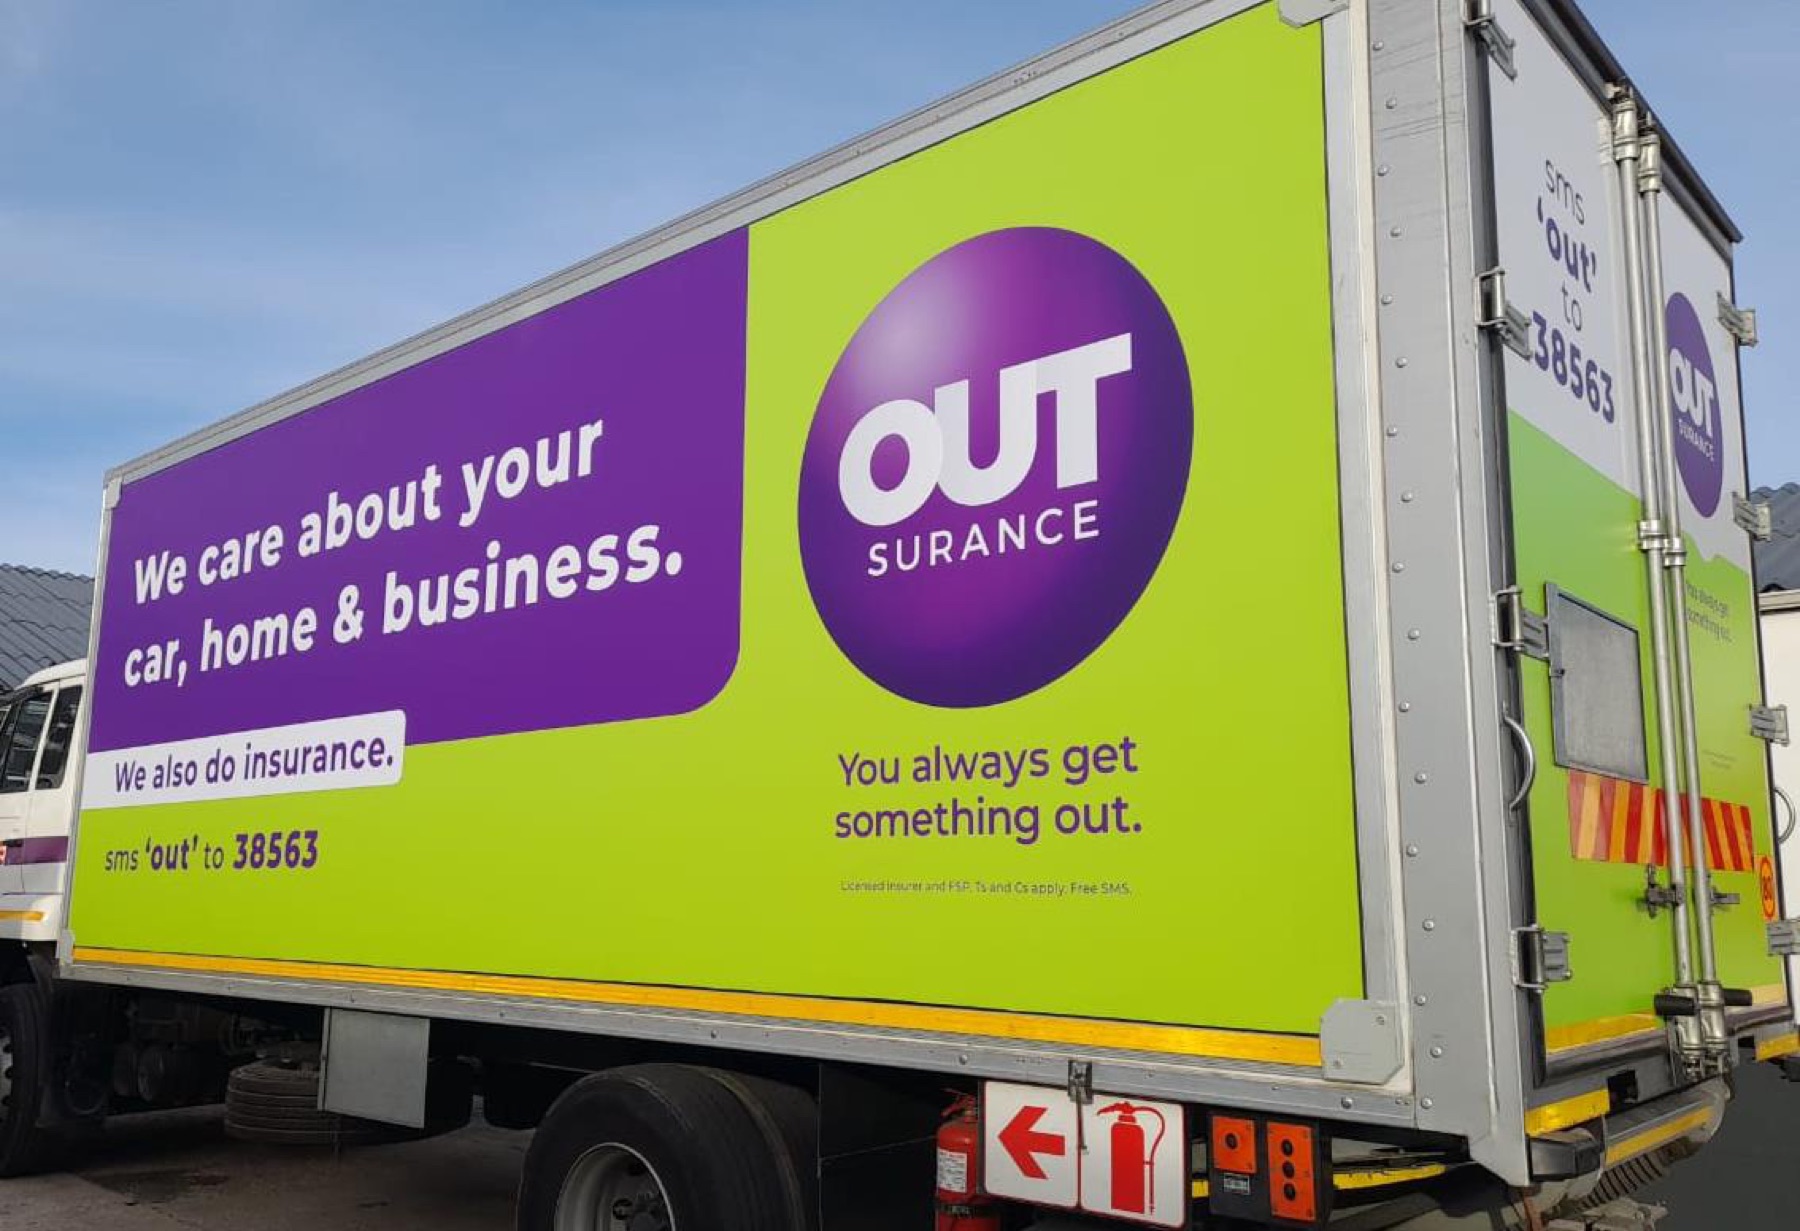
Daily delivery loops are computed with the Google Routes API from each regional depot: three waypoints are placed around the hub and the engine accepts only loops within ±10% of the tonnage's contracted distance (135 km/day for 4-Ton, 7 h driving). Loops follow real road geometry, turn restrictions and road classes.
Around each route we build a 150 m exposure corridor — the practical legibility distance of truck-side branding. Points of interest are surveyed with the Google Places API (supermarkets, malls, fuel stations, banks, restaurants, schools, automotive) at anchors along the corridor, and weighted by foot-traffic category.
Pedestrian: weighted POI count × dwell factor × βped. Vehicle: road-class-weighted km × dwell factor × βveh. Slower traffic ⇒ longer exposure (dwell capped at 2.5×). A 0.5 visibility factor counts one truck side per viewer. Street names are extracted from the routing engine's turn-by-turn instructions, and each street is credited with the vehicle impressions earned on its segments.
β constants are calibrated so the Gauteng 4-Ton anchor lands at 50,000 daily impressions per truck — the midpoint of the OHMSA range for South African mobile billboards (30k–80k). Other hubs are independent verification points.
The animation replays one operating day (08:00–15:00) on live Google satellite imagery. Truck positions are interpolated along the actual route polyline; counters accrue impressions in proportion to distance covered. Hubs marked survey pending use the calibrated model on modelled POI densities until live data is collected.